
 S.E.A.M.
Socio-Economic-Approach-to-Management the 2nd Pillar of
GrowthOD 📞 Book a
GrowthOD Consultation -
S.E.A.M.
Socio-Economic-Approach-to-Management the 2nd Pillar of
GrowthOD 📞 Book a
GrowthOD Consultation -
Voice: The
Hidden Cost Alchemist
Full Pillar Name: Socio-Economic
Approach to Management
Introduction: Why SEAM
Matters
In most organizations,
energy is leaking from the system, silently. This leak doesn’t
show up in quarterly earnings or polished dashboards—but in
absenteeism, turnover, poor coordination, demoralized teams, and
wasted time. SEAM—Socio-Economic Approach to Management—is
the pillar of GROWTH OD that makes this invisible
visible.
Developed over 50
years by Henri Savall and the ISEOR Institute in France, and
taught for two decades by Dr. David Boje in the U.S., SEAM is
both a diagnostic method and
a transformation engine. It
provides leaders and consultants with practical tools to uncover
“hidden costs” and recycle them into value. In the GROWTH OD
framework, SEAM is known as The Hidden
Cost Alchemist because it
transmutes dysfunction into transformation—not by punishing
people, but by healing broken processes, misaligned systems, and
ignored potential.
Scientific Roots of SEAM
The Consulting/Coaching Cycle of SEAM Scientific
Inquiry
Each coaching journey follows an inquiry arc:
1. Observe — What are we noticing?
2. Question — What’s the deeper story?
3. Hypothesize — What value gaps, traumas, or systemic
contradictions may explain this?
4. Experiment — Try new actions, story rituals,
organizational prototypes
5. Analyze — What worked? What shifted?
6. Revise — Update the story and reframe
assumptions
SEAM is grounded in socio-economic science. Its foundational theory: most accounting systems are blind to dysfunction because they only measure outputs, not the systemic constraints that hinder them. These hidden dysfunctions are not anomalies—they are signals.
Introducing the
SEAM's Four Leaf Clover
Upper Leaf of Dysfunction Categories
SEAM
classifies dysfunctions using the Cloverleaf Model
1. Work
Conditions
Unsafe environments, outdated equipment, ergonomic strain, or
psychological stressors.
2. Work
Organization
Role ambiguity, redundant processes, overcontrol, or
under-delegation.
3. Three
Cs of Communication- Coordination-Cooperation
Missing feedback loops, email overload, secrecy, or
over-formalized reporting.
4. Time
Management
Are people spending time in value added ways (what
Axiogenics calls 'net value')?
5. Training
Are people trained in what brings 'net value'? Are people in
need of training getting the training they need?
6. Strategic
Implementation
Oftentimes, organizations are so busy putting out fires in the
first five dysfunctions, people are not doing strategic
implementaiton.
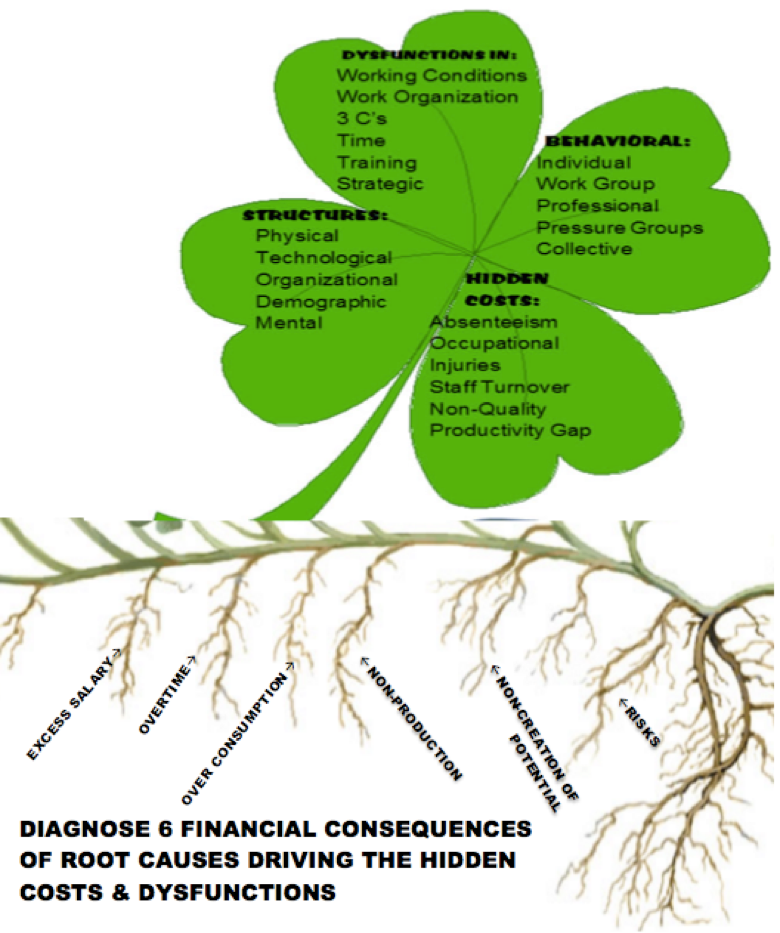
Savall’s research identified Six key Financial Consequences Root
Causes driving Dysfunctions
1. Excess
Salary
2. Turnover
3. Work
accidents
4. Non-quality
5. Overtime
and over-consumption of resources
6. Lost
opportunity and unrealized potential
The Hidden Costs add
up—often representing 20–30% of
payroll. SEAM practitioners use participatory
diagnostics, logbook modeling, and financial simulation tools to
quantify these costs and create actionable recovery plans.
What are the Hidden
Costs that don't show up on an Organizations Accounting
Reports and Spreadsheets?
1. Absenteeism
When people are
overworked, they burnout, get ill more often, and cannot
contribute 100%.
2. Occupational
Injuries
Injuries from lack of
safety routines, doing too many jobs at once, and so on incur
costs of insurance claims, contribute to low morale ...
3. Staff Turnover
We give the example
of millennial turn over. Millennials are now 75% of the global
workforce.
4. Non-Quality of
Products and Services
It takes a process
consultation diagnostic to assess how system work processes are
coming undone. It's the 2nd Law of Thermodynamics..
5. Productivity Gaps
Productivity will come undone with out continuous improvement
interventions.
| -Salary
1 |
Excess Time
2 |
Over-Compensation
3 |
Non-production
4 |
Non-creation of Potential
5 |
Total Hidden Costs
1+2+3+4+5 |
RISKS TO Organization |
|
| Absenteeism | |||||||
| Accidents | |||||||
| Turnover | |||||||
| Non-Quality | |||||||
| Productivity Variance | |||||||
| TOTAL | Excess salary from 5 indicators | Overtime from 5 indicators | Over-consumption from 5 indicators | Non-production form 5 indicators | Non-creation of potential from 5 indicators | TOTAL HIDDEN COSTS | Risks from all 5 Indicators |
Each leaf is explored
during interviews and observations. SEAM’s method shows how
dysfunction in one area cascades across others. For example,
poor coordination can lead to overwork, which causes stress,
which leads to absenteeism, turnover, etc.
💰 The
Hidden Costs
Over 50% of
business costs are hidden from
accounting reports—and 40% are buried under trauma memories and
stuck thoughts that PERVIEW is designed to address.
•Disconnection from Organizational
Story and Values: Millennials often seek purpose-driven
work environments. A lack of alignment with company values can
lead to disengagement.
•Lack of Communication, Coordination, and Cooperation (3
Cs): Ineffective communication and collaboration structures
can hinder millennial's' sense of belonging and contribution.
•Burnout, Misalignment, and Unprocessed Trauma: High
expectations without adequate support can result in burnout and
emotional exhaustion.
Over 50% of business costs are hidden from accounting reports, and 40% are buried under trauma memories and stuck thoughts.
- Direct
Costs that do not show up on Accounting Statement:
- Recruitment and Hiring: Advertising vacancies, screening candidates, conducting interviews, background checks, and potential recruitment agency fees. These costs can range from a few thousand dollars to a substantial portion of an employee's salary.
- Onboarding: Activities like orientation and getting new hires familiar with company procedures and culture.
- Financial
Impacts that do not show up on Accounting Statements:
- Replacing an employee can cost 50% to 200% of their annual salary, depending on the role and industry.
- Estimates suggest replacing an entry-level employee making $36,000 can cost $12,000.
- The overall cost of onboarding a new hire can range from $4,100 to over $20,000.
- New Hire Training: Getting new employees up to speed on their responsibilities and the tools they need.
- Average Annual Training Costs: Organizations spend an average of $1,252 per employee per year on training, including established employees. The cost of training a new hire from scratch can be higher.
- Wasted Investment: If a new hire leaves quickly, the training investment is lost, requiring a repeat of the expense for a replacement.
- Decreased Morale and Productivity: Frequent departures can erode trust, create a sense of instability, and negatively affect team dynamics and collaboration.
- Increased Workload and Burnout: Remaining employees often have to take on extra responsibilities, leading to increased stress and potential burnout.
- Loss of Knowledge and Expertise: Experienced employees take valuable institutional knowledge with them when they leave, impacting workflows and potentially customer satisfaction.
- Negative Impact on Company Reputation: High turnover rates can make it harder to attract top talent and further erode employee morale.
- Millennial turnover is estimated to cost the U.S. economy $30.5 billion annually.
- While some concerns about millennial job-hopping may be exaggerated, it's important to focus on the rising cost of turnover for this generation, which is partly linked to higher salaries.
- Millennials are the least engaged generation in the workforce, with only 30% reporting feeling engaged.
- A higher percentage of Millennials (36%) compared to non-Millennials (21%) plan to look for a job with a different organization in the next 12 months if the job market improves.
- Invest in employee retention strategies: Offering competitive salaries and benefits, fostering a positive work environment, providing professional development opportunities, and recognizing employee contributions can help reduce turnover.
- Improve the onboarding process: A well-structured onboarding process helps new hires get up to speed quickly and feel integrated into the company culture, reducing the risk of early departure.
- Focus on employee engagement: Engaged employees are more likely to stay with the company and perform at a higher level, positively impacting productivity and reducing turnover.
Illustration of
Hypothesized ‘Hidden Cost Calculation’ at New Mexico State
University
|
5 Indicators of Dysfunctions: |
Components | ||||||||
| Qualitative examples | Quantitative examples
|
Over-Salary
1 |
Excess Time
2 |
Over-Compensation
3 |
Non-production (lost revenue)
4 |
Non-creation of [human] Potential
5 |
Total Hidden Costs
1+2+3+4+5 |
RISKS TO NMSU | |
| Absentee People from Downsizing, etc. | People left & not replaced; Higher paid administrators micromanage remaining faculty, | 7% more time to get things done by those left | $600000 | 300000 | 500000 | 1000000 | 500000 | $2,900,000 | |
| Accidents | More health claims from stress of overwork | 5% more health claims | $70000 | 200000 | 100000 | 200000 | 300000 | $870,000 | |
| Turnover | High turnover faculty due to low morale, uncertainty of change, & frozen salaries | 20% more Cost of training students to do work of staff; staff to do work of faculty who left | $200000 | 100000 | 600000 | 300000 | 900000 | $2,100,000 | |
| Non-Quality | Less qualified people (student workers, etc. pitch in but with weaker results | 20% more costs of Faculty and graduate student teachers, and temps (visitors) filling in for classes of missing faculty | $400000 | 300000 | 400000 | 2000000 | 800000 | $3,900,000 | |
| Productivity Variance | Since everyone is doing work of the missing personnel, much of the work of teaching and research, and coordination falls through the cracks | 10% loss in NMSU reputation, which means fewer students & faculty willing to come he | $900000 | 600000 | 700000 | 300000 | 800000 | $3,300,000 | |
| TOTAL | Excess salary from 5 indicators | Overtime from 5 indicators
|
Over-consumption from 5 indicators | Non-production form 5 indicators | Non-creation of potential from 5 indicators | TOTAL HIDDEN COSTS | Risks from all 5 Indicators
Add 2 million more in lawsuits
|
||
| $2,170,000 | 1500000 | 2300000 | 3800000 | 3300000 | $13,070,000 | $15,070,000 | |||
Instead of dealing
with $15,070,000 in
financial losses, NMSU spent
almost $1 million dollars to hire one of the big six
consulting firms for two week, and their MBAs that did a
spreadsheet analysis, to identify which older professors were
the highest paid, then proceeded, to harass them every way
possible until they quit. So short sighted. It is a tragic
case of shareholder capitalism in Higher Education. The
shareholders in this case are the Trustees, who care more
about sports than higher ed. Currently, many departments and
entire colleges are understaffed, there is no money to
hire tenured faculty in the social sciences, so temporary
contract adjunct faculty were hired without benefits. Too few
people doing far too many jobs, wearing too many hats as they
burn out. The moral of the story: It could have been a very
different result is SEAM GrowthOD had been chosen. Here
is a better kind of OD.
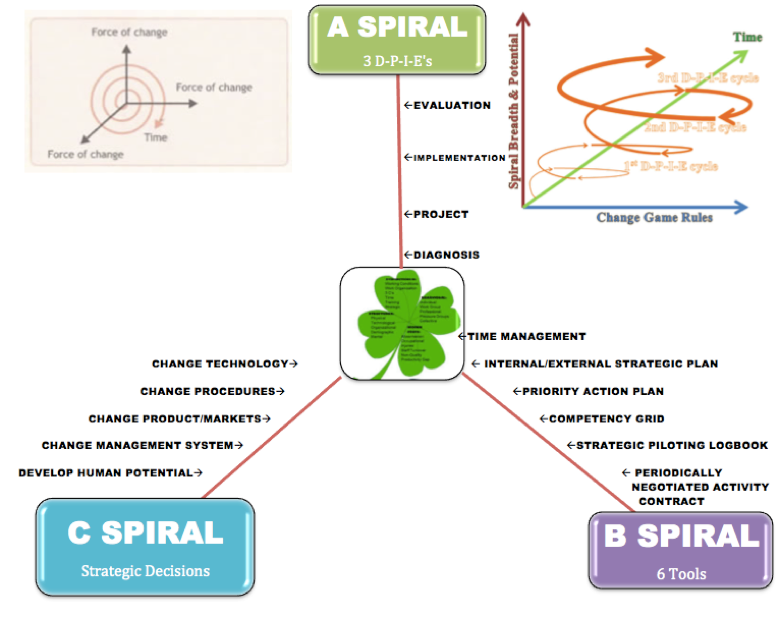
SEAM has three Spirals
A-Spiral is
the intervention of three or more successive rounds of D-P-I-E
(Diagnosis-Project planning-Interventions-Evaluation). DPIE
teams are lunched across the organization with the goal of
DIAGNOSIS, identifying hidden costs, root causes of weak
socio-economic financial performance. PROJECT PLANNING to
recycle hidden costs into new revenue streams by unleashing
Human Potential. IMPLEMENTATION means getting the job done
right, by innovating, being intrapreneurs. Then comes the
EVALUATION of qualitative, quantitative, and financial outcomes
(known as Qualimetrics).


Figure 3: Implementing successive DPIE’s (Diagnosis-Project Design-Implementation-Evaluation cycles) to rebuild NMSU Momentum
B-Spiral
is the six SEAM Tools that are taught to the DPIE team
members.
First Tool: Time
Management Tool
- Focus on Dysfunctions and Hidden Costs: SEAM's approach involves identifying and analyzing organizational dysfunctions that lead to hidden costs, including issues related to time management.
- Time Management as a Key Component of Improvement: By addressing dysfunctions related to time management (e.g., in communication, coordination, and cooperation), organizations can reduce hidden costs and improve overall socio-economic performance.
- Diagnosing Time-Related Issues: SEAM utilizes a diagnostic process to uncover how specific routines and behaviors contribute to poor time management within the organization, such as issues related to working conditions, excessive overtime, or non-production.
- Designing Interventions: Based on the diagnostic findings, SEAM aims to design interventions to address these time-related issues, leading to improved resource allocation and increased efficiency.
- Utilizing
Time-Based Data: While specific time
management tools like time trackers or scheduling apps
aren't explicitly described as part of SEAM," the approach
emphasizes transparency in output metrics and using data to
inform decisions about optimizing time allocation.
- Focus on External Targets: The strategic plan focuses on external targets like product-market pairs, customers, and suppliers.
- Formalizing Strategy: It helps organizations formalize their overall strategy.
- Integration of Internal and External Elements: The internal and external analysis (identifying strengths, weaknesses, opportunities, and threats) informs the strategic plan, helping organizations to develop strategies that capitalize on strengths, address weaknesses, overcome competition, and mitigate external threats.
- Alignment of Strategy and Execution: The SEAM framework uses five strategic components, starting from strategy to execution, ensuring alignment through metrics and measurements.
- Action Planning: Based on identified issues and dysfunctions, action plans are developed and implemented to address them and drive improvements.
IESP (Internal/External Strategic Plan)
| OBJECTIVES | 2017 | 2018 | 2019 | 2020 | 2021 | |||||
| Spring | Fall | Spring | Fall | Spring | Fall | Spring | Fall | Spring | Fall | |
| OBJECTIVE 1:
|
||||||||||
| Actions to fight against
depletion of resources
|
||||||||||
| OBJECTIVE 2:
|
||||||||||
| Actions to increase human potential | ||||||||||
| OBJECTIVE 3:
|
||||||||||
| Actions that create SUSTAINABILITY | ||||||||||
In essence, SEAM strategic plan tool helps organizations to:
- Analyze their environment: Understand the internal and external factors influencing their operations.
- Develop actionable strategies: Create a roadmap for achieving their objectives based on this analysis.
- Formalize and communicate their plan: Document and share their strategic direction with stakeholders.
- Align actions with strategy: Ensure that initiatives and projects contribute to the overall strategic goals.
- Monitor progress and make adjustments: Track performance and adapt the plan as needed.
Each DPIE team develops their PAP, after doing a diagnosis of hidden costs, then propose small scale projects of redesign by making successive modification in such areas as work organization, working conditions, communication-cooperation-coordination (hereafter, 3C’s), time management, training, and strategy implementation that increases quality performance.
| STRATEGIC AXES | OBJECTIVES | PRIORITY ACTIONS | PEOPLE CONCERNED | FORCAST PLANNING 6 months | METRICS: Qualitative & Quantitative | |||||||
| J | F | M | A | M | J | |||||||
| Our Team’s Collective Target
|
☐- | ☐-
☐-
☐- |
☐-
☐- ☐- ☐-
|
☐- | ||||||||
| Our Team’s Mission Target
|
☐- | ☐-
☐- |
☐-
☐- |
☐- | ||||||||
| Our Team’s Vision Target
|
☐- | ☐- | ☐-
☐-
|
☐- | ||||||||
| Our Team’s Operations Targets
|
☐- | ☐- | ☐-
☐- ☐- |
☐- | ||||||||
| Our Team’s Research Targets
|
☐- | ☐- | ☐-
☐- |
☐- | ||||||||
| Our Team’s Strategic Targets
|
☐- | ☐- | ☐-
☐-. ☐- ☐- . |
☐- | ||||||||
| Team Member 1
|
☐- | ☐- | ☐-
☐- |
☐- | ||||||||
| Team Member 2
|
☐- | ☐- | ☐-
☐- |
☐- | ||||||||
| Team Member 3
|
☐- | ☐- | ☐-
☐-
|
☐-
|
||||||||
| Add team members… | ||||||||||||
These would be self-financing interventions from diagnosing hidden costs of various NMSU dysfunctions, adapting both the NMSU structures and patterns of human behavior, to lower hidden costs that gets us into a better competitive and quality performance position. Rather than lowering wages, we actually cut those hidden costs of the organization (e.g. bureaucratic dysfunctions) in order to increase rewards for all. The PAP is short-term (say six months) and the next tool is longer term.
Fourth Tool: Competency Grid Tool
C: CG TOOL (note: the items are for illustration)
| COMPETENCY GRID BEFORE THE CHANGE | ||||||||
| Traditional Competencies in old objectives | New Competencies to be Acquired | |||||||
| WORKERS | Green Product Design | Green Supply Chain | Materials Recycling | Energy Savings | Product Knowledge | Contracts | Project Management | Customer Service |
| A | n | ☐ | ☐ | n | ☐ | ☐ | n | |
| B | ☐ | ☐ | ☐ | n | ☐ | n | n | |
| C | ☐ | n | n | ☐ | ||||
| D | ☐ | ☐ | n | ☐ | ☐ | |||
| E | n | ☐ | n | n | n | ☐ | ☐ | |
| F | n | n | n | ☐ | ☐ | ☐ | ||
| COMPETENCY GRID AFTER THE CHANGE | ||||||||
| A | n | n | n | n | ☐ | ☐ | n | |
| B | ☐ | n | n | n | ☐ | n | n | |
| C | ☐ | ☐ | n | n | n | ☐ | ||
| D | ☐ | ☐ | n | n | ☐ | ☐ | ☐ | |
| E | n | ☐ | n | n | n | n | ☐ | n |
| F | n | n | n | n | n | n | ☐ | n |
n=Frequently Practiced =Occasional Practiced/Not all Mastered
☐=Knowledge of Principles without Practice BLANK= No Knowledge or Practice
Fifth Tool: Strategic Piloting Logbook Tool
This is where you keep your various TOOLS,
such as PNAC, PAP, IESP, etc. There are also pages that have
post-it notes to keep various aspects of your client project
organized. It is called Piloting Logbook because PILOTING
means to steer your own course, and that's the basis of
strategy implementation. Collect metrics for Financial and Sustainability
Indicators-Include detailed verbatim notes of
storytelling, living stories of human potential, stories of
sustainability, and any intervention recommendatiosn made to
implement Piloting Logbook indicators.
In SEAM, people who bring about
innovations that have positive financial consequences ofr an
organization receive a percentage of the gain for an agreed
time period. IT is part of what Henri Savall calls Responsible
Capitalism, and it is part of sharing the rwwards from
Unleashing Human Poetential to add to Net value of the
organization (See Axiogenics).
|
PILOTING LOGBOOK - WEEKLY PLAN: YOUR
NAME______________________________________ YOUR
TEAM_____________________________ |
||||||||
|
Participation slips Record # of slips 0 to 3
[max] and date below WHO IS YOUR
CLIENT?_______________________________________________ |
Below
record the graded score of your homework answers (show
any late or missing work): |
|||||||
|
Week 1 |
Week 6 |
Week 11 |
1 |
6 |
|
|||
|
Week 2 |
Week 7 |
Week 12 |
2 |
7 |
|
|||
|
Week 3 |
Week 8 |
Week 14 |
3 |
8 |
|
|||
|
Week 4 |
Week 9 |
Week 15 |
4 |
9 |
|
|||
|
Week 5 |
Week 10 |
Week 16 |
5 |
10 |
|
|||
|
Dates
Make ups for any missed days completed (keep copies |
RECORD All Dates & Times You personally
met with your client (phone or face-to-face) and
notes |
|||||||
|
RECORD BELOW YOUR MIDTERM TEAM REPORT GRADE
AND GRADE YOU RECEIVED ON PEER EVALUATION AND ANY
COMMENTS YOU RECEIVED ON YOUR PERFORMANCE |
Date
of client meeting |
Content
of client meeting |
||||||
|
RECORD YOUR MIDTERM PROJECT REPORT GRADE AND
GRADE YOU RECEIVED ON PEER EVALUATION AND ANY
COMMENTS RECEIVED ON YOUR OWN PERFORMANCE |
|
|
|
|||||
|
|
|
|
||||||
|
|
|
|
||||||
|
|
|
|
|
|
||||
|
|
|
|
|
|
||||
|
|
|
|
|
|
||||
|
FIRST
DPIE SPIRAL BEGINS Step
1 - DIAGNOSTIC (A-spiral using 4-leaf clover) and do
1st round of PNAC |
WHEN did you do something? |
WHAT DID YOU DO PERSONALLY? |
|
Step
2 Time Management Tool: Spiral B’s first tool |
|
|
|
Step
3 - Direction (C-spiral first location), which is also
the 1st D-question (Directionality) of Boje's
D-Spiral. |
|
|
|
Step
4 - Project planning (A-spiral) done
collaboratively with your
client |
|
|
|
Step
5 - Strategic Piloting Logbook tool (B-spiral) |
|
|
|
Step
6 – CHANGE PROCEDURES to change Rules of the game -
(C-spiral) |
|
|
|
Step
7 - D2 – Datability (D-Spiral): What are the most
important datable moments in the life story of the
business? |
|
|
|
Step
8 - Mirror Effect meeting with client (A-spiral, part
of D-P-I-E cycle) |
|
|
|
Step
9 - Implement project (DPIE 1) in collaboration with
your client (A-spiral) |
|
|
|
Step
10 - Priority Action Plan tool (B-spiral) |
|
|
|
SECOND
DPIE SPIRAL WHORL |
|
|
|
2nd
DPIE BEGINS ABOUT HERE --> Step 11 – Evaluate
results of 1st DPIE and begin DIAGNOSIS 2 for 2nd DPIP
Resource Deployment (C-spiral) |
|
|
|
Step
12 - D3 and D4 (Q-Spiral: Durability and
Disclosability) |
|
|
MIDTERM steps 1 to 12 due
|
|
|
|
Step
13 – DPIE 2 MIRROR EFFECT # 2 (A-spiral) – and detail
your metrics, the Logbook tool (B-Spiral) indicators
you have documented to date |
|
|
|
Step
14 - Competency Grid (B-spiral) |
|
|
|
Step
15 - D5, D6, D7 (Spiral: Destining, Deployment, &
Dwelling) |
|
|
|
THIRD
DIPE SPIRAL WHORL |
|
|
|
Step
16 – Evaluation of 2nd DPIE – (A-spiral) Evaluate
Project # 2, Diagnostic, Project plan for 3rd DPIE
project, and includes 3rd MIRROR EFFECT meeting with
client |
|
|
|
Step
17 - I/E SP (Internal/External Strategic Plan)
(B-spiral Tool 5) |
|
|
|
Step
18 - More D's (Spiral: Deseverance & Drafts) |
|
|
|
Step
19 - Complete the Evaluation (A-spiral) of the 3rd
project |
|
|
|
Step
20 - PNAC (Periodically Negotiable Activity Contract) |
|
|
Step
21 - technological, product market, management
systems, and develop human resources C-spiral
|
|
|
|
Step
22 - Last D's (Spiral: Dispersion & Detaching) |
|
|
|
Step
23 - Draw amazing spirals for the draining of
dysfunctions and hidden cost (downward spiral) and the
upward spiral momentum from the 3 DPIEs that generated
revenues |
|
|
Any plagiarism or cheats will result
in Failing Grade for assignments and or project and or
course grade
Sixth Tool: PNAC (Periodically
Negotiated Activity Contract)
The PNAC is your contract
between you and your instructor. PNAC stands for
"Periodically Negotiated Activity Contract". SEAM uses the
PNAC tool to get management and employees to negotiate
roles, tasks, and rewards. Contracting is the basis of a
more democratic Work Organization where employees share in
rewards for the innovations and successes they bring about.
PNAC (Periodically Negotiated Activity Contract)
NAME:________________________________ for 6 MONTHS
þ-Focus on your targets; negotiate ways to do them; rewards sought for achieving target levels
☐-PNAC connects with PAP, Strategic Indictors & Economic Balance
–Economic balances compare cost of means to reach objective with returns once targets have been attained (in terms of potential gains)
ý-$$ incentives self-financed by reduction in hidden costs
| Types of Objectives | Objectives | Weighting (of 100% total) | Target Level | Means | Metrics |
| CLIENT’S GENERAL TARGET
|
☐- | ___% | What: | How: | ☐- |
| CLIENT’S
COLLECTIVE PRODUCTION TARGET
|
☐- | ___% | What: | How: | ☐- |
| Your TEAM TARGET
|
☐- | ___% | What: | How: | ☐- |
| INDIVIDUAL # 1 TARGET 1
|
☐- | ___% | What: | How: | ☐- |
| INDIVIDUAL # 2 INDIVIDUAL TARGET 2
|
☐- | ___% | What: | How: | ☐- |
| INDIVIDUAL # 3 INDIVIDUAL TARGET 3
|
☐- | ___% | What: | How: | ☐- |
| INDIVIDUAL # 4 INDIVIDUAL TARGET 4
|
☐-2 Book project | ___% | What? | How: | ☐- |
|
PNAC
(Periodically Negotiated Activity Contract) Date of
Contract____/____/2025 NAME: NAME OF CLIENT’S BUSINESS: INSTRUCTIONS:
First check ☐ Particular
Goals and Boundaries Team & Client are most
interested in. Then fill in the Client’s Main
Business Development Objective, and Outline 3 DPIE’s
with your client. |
|||||||
|
☐ Goal 1. End poverty in all its
forms everywhere |
☐ Goal 2. End hunger, achieve
food security and improved nutrition and promote
sustainable agriculture |
☐ Goal 3. Ensure healthy lives
and promote well-being for all at all ages |
☐ Goal 4. Ensure inclusive and
equitable quality education and promote lifelong
learning opportunities for all |
||||
|
☐ Goal 17. Strengthen the means
of implementation and revitalize the global
partnership for sustainable development |
CLIENT MAIN OBJECTIVE TEAM DPIE · When · Where · Who s involved · What resources · Why |
☐ Goal 5. Achieve gender
equality and empower all women and girls |
|||||
|
☐ Goal 6. Ensure availability
and sustainable management of water and sanitation for
all |
|||||||
|
☐ Goal 16. Promote peaceful and
inclusive societies for sustainable development,
provide access to justice for all and build effective,
accountable and inclusive institutions at all levels |
☐ Goal 7. Ensure access to
affordable, reliable, sustainable and modern energy
for all |
||||||
|
☐ Goal 15. Protect, restore and
promote sustainable use of terrestrial ecosystems,
sustainably manage forests, combat desertification,
and halt and reverse land degradation and halt
biodiversity loss |
☐ Goal 8. Promote sustained,
inclusive and sustainable economic growth, full and
productive employment and decent work for all |
||||||
|
☐ Goal 14. Conserve and
sustainably use the oceans, seas and marine resources
for sustainable development |
☐ Goal 9. Build resilient
infrastructure, promote inclusive and sustainable
industrialization and foster innovation |
||||||
|
☐ Goal 13. Take urgent action to
combat climate change and its impacts |
☐ Goal 12. Ensure sustainable
consumption and production patterns |
☐ Goal 11. Make cities and human
settlements inclusive, safe, resilient and sustainable |
☐ Goal 10. Reduce inequality
within and among countries |
||||
|
NINE PLANETARY BOUNDARIES: |
☐ Boundary 1. Climate Change |
☐ Boundary 2. Biodiversity Loss |
☐ Boundary 3. Biogeochemical
(phosphorous change |
☐ Boundary 4. Ocean
Acidification |
|||
|
☐ Boundary 5. Land Use Crisis |
☐ Boundary 6. Fresh Water Crisis |
☐ Boundary 7. Ozone Depletion |
☐ Boundary 8. Atmospheric
Aerosols |
☐ Boundary 9. Chemical Pollution
by Plastics & Heavy Metals |
|||
IMPORTANT:
Please revise the PNAC with your client whenever there is a
change in Client’s Main Objective or any new tasks are added
outside the 3 DPIE’s
C-Spiral Five
Strategic Decisions
Growth OD pillar of Socio-Economic Approach to Management (SEAM) is designed to be holistic framework for organizational development and change that integrates narrative analysis, systems thinking, and strategic intervention. SEAM’s methodology aligns closely with the five strategic decision areas you listed, offering a dynamic, participatory approach to transformation.
1.
-
: SEAM recognizes technology as an “actant” that mediates human routines and organizational habits. Rather than treating technology as a separate or purely technical issue, SEAM situates technology within the broader ecology of routines and the “ensemble of multiplicities.” This means technological change is always embedded in, and must be co-evolved with, human practices, stories, and organizational culture.
-
: SEAM consultants diagnose how technology shapes routines and where dysfunctions or hidden costs arise, then co-create interventions that integrate new technologies with changes in work practices and narratives.
2.
-
: Procedures are viewed as routinized behaviors that can become dysfunctional over time. SEAM intervenes by uncovering the “living stories” behind these routines, making visible the often-hidden costs and inefficiencies that standardized procedures may create.
-
: Through participatory diagnosis and the “mirror effect,” SEAM helps organizations re-story their procedures, shifting from passive repetition to agile, reflective practices that support strategic goals.
3.
-
: SEAM connects internal change to the external environment, including products and markets. Strategic decisions about products and markets are not isolated; they are woven into the organization’s stories, competencies, and collective sensemaking.
-
: SEAM’s diagnostic process includes both internal and external analyses, linking changes in products/markets to shifts in routines, competencies, and the broader organizational narrative.
4.
-
: Management systems are seen as dynamic, evolving structures. SEAM emphasizes democratic participation, distributed leadership, and the development of “ensemble leadership” rather than top-down control.
-
: SEAM interventions often involve redesigning management systems to foster communication, cooperation, and coordination (the “3 C’s”), supporting a shift from micromanagement to empowerment and agility.
5.
-
: Developing human potential is central to SEAM’s philosophy. The approach seeks to uncover and release untapped capacities by addressing dysfunctions, hidden costs, and disempowering routines.
-
: SEAM uses tools like competency grids, participatory training, and negotiated activity contracts to align individual growth with organizational objectives, creating an upward spiral of socio-economic progress.
Boje’s SEAM model visualizes these five strategic decision areas as interconnected spirals, emphasizing that progress in one area reinforces and is reinforced by the others. The process is iterative and participatory, involving cycles of diagnosis, project planning, implementation, and evaluation—all grounded in both qualitative and quantitative analysis.
Summary Table: SEAM and the Five Strategic Decisions
| Strategic Decision | SEAM Approach |
|---|---|
| Change Technology | Technology as part of routines and stories; integrated with human and organizational change |
| Change Procedures | Diagnosing and re-storying routines to eliminate dysfunctions and hidden costs |
| Change Products/Markets | Linking internal change to external strategy; aligning products/markets with organizational story |
| Change Management System | Democratic participation, distributed leadership, and agile management systems |
| Develop Human Potential | Releasing untapped capacity through participatory tools and alignment with strategic objectives |
SEAM provides a robust, narrative-driven framework for making and implementing these five strategic decisions, ensuring that change is systemic, participatory, and sustainable
SEAM also teaches us that healthy organizations
satisfy four
norms simultaneously:
1. Economic – Profitability, efficiency,
performance.
2. Social – Well-being, development, fairness.
3. Environmental – Sustainability, stewardship, resource
use.
4. Democratic – Voice, transparency, participatory
culture.
In Disney’s current structure, the economic norm dominates. Performance metrics, quarterly
results, and guest ratings dictate decisions. Meanwhile:
· Social
norms (employee development, rest,
recognition) are underfunded.
· Democratic
norms (voice, participation, empowerment) are
suppressed under tight scripting and surveillance.
· Environmental
norms are inconsistently addressed, with
sustainability unevenly prioritized across divisions.
This imbalance drives millennial disillusionment. They
are not just quitting jobs—they are quitting systems that
ignore their values. And that values-gap becomes measurable—in
attrition, disengagement, and reputational risk.
Listening as Strategic Action
One of SEAM’s most powerful tools is the Mirror Effect Meeting—a facilitated process in which
narrative data and cost models are shared back with the
organization. It’s not an HR survey—it’s a strategic
truth-telling.
Imagine a cross-level session at Disney in which
executives hear the following:
“We smile through our exhaustion because anything less
gets documented.”
“We speak ‘Disney language’ even when we’re breaking inside.”
“We see where the magic used to be, but we’re not allowed to
say it’s gone.”
Then imagine seeing those statements paired with the actual
financial impact of turnover, absenteeism, and
disengagement.
This is the moment where story and system meet. It’s
the turning point from narrative dissonance to systemic
alignment.
The Hidden Cost Grid
SEAM practitioners use a diagnostic tool called the Hidden
Cost Grid,
mapping dysfunctions across cost categories:
|
Dysfunction |
Absenteeism |
Turnover |
Non-Quality |
Lost
Productivity |
Accidents |
|
Role
Confusion |
$1.2M |
$3.1M |
$600K |
$2.7M |
— |
|
Scripting
Pressure |
$4.4M |
$7.9M |
$1.8M |
$3.6M |
$300K |
|
Lack
of Mentoring |
$2.2M |
$5.0M |
— |
$4.1M |
— |
|
Emotional
Labor Fatigue |
$5.5M |
$9.2M |
$2.6M |
$6.3M |
$450K |
The total hidden cost in this hypothetical grid
exceeds $50
million.
Multiply this across departments and fiscal years, and you
begin to see why millennial turnover is not a trend—it’s a
structural red flag.
Step-by-Step: SEAM in
Practice
1. Participatory
Interviews
Consultants interview a broad cross-section of employees—from
executive suite to front-line. These interviews are coded for
dysfunction patterns, not blame.
2. Logbook
of Hidden Costs
Consultants use a spreadsheet model to link qualitative
dysfunctions to quantitative estimates of cost leakage.
3. Financial
Simulation
Using conservative assumptions, SEAM projects cost-recovery
scenarios. These “what-if” simulations show how addressing root
causes pays off—often within 6–12 months.
4. Action
Planning
Collaborative sessions with leadership and front-line staff
develop implementation strategies that recycle hidden costs into
well-being and productivity.
5. Ongoing
Measurement
Results are tracked using a mix of financial KPIs and
qualitative narrative feedback. A successful SEAM project often
shows 15–30% cost recovery and profound cultural shifts.
Example: SEAM at a
Distribution Center
A national retailer
engaged SEAM to address chronic delays and staff burnout in
their regional distribution center. SEAM interviews uncovered:
· Workers
were skipping meal breaks to meet quotas (work conditions).
· Managers
were unclear about scheduling authority (work organization).
· Email
overload was delaying responses to critical delivery issues
(communication).
· Departments
worked in silos, duplicating order prep (coordination).
SEAM quantified $2.1
million in hidden costs annually. Within six months,
implementation of cross-shift communication boards, streamlined
protocols, and leadership retraining led to:
· 18%
increase in on-time deliveries
· 22%
reduction in overtime
· 26%
reduction in burnout-related turnover
Employees reported feeling
seen for the first time. A night shift worker
said:
“They used to ask what
I did. Now they ask what I see.”
Coaching Questions for
SEAM-Based Transformation
Use these prompts to
facilitate SEAM-style diagnosis with clients:
· Where
are you noticing repeated miscommunications, and what are they
costing?
· How
is your team’s time being spent—and wasted?
· What
roles are over-functioning, and which are underutilized?
· Where
is energy going—but not producing value?
· Who
is doing work that’s invisible to management or unmeasured by
KPIs?
· What
pain point do people joke about because they’ve given up trying
to fix it?
SEAM’s Integration
with the Other Four Pillars
SEAM does not stand
alone—it interweaves with every other
GROWTH OD pillar to create
coherence.
· With
P.E.R.V.I.E.W.
Dysfunction is often tied to negative story filters (“We’re just
a cost center.”) that need restorying. SEAM reveals the story;
PER heals it.
· With
AXIOGENICS
SEAM helps frame ethical, moment-by-moment decisions around
resource use. What choice now will recover the most lost value?
· With
G.L.O.W.
When people feel their frustrations are finally heard and acted
on, gratitude and trust rise. SEAM unlocks emotional energy by
honoring hidden labor.
· With
A.A.M.
SEAM’s financial models surface assumptions (“Overtime means
commitment”) that can be critically examined using Trafimow’s
Auxiliary Assumptions Method.
Hidden Wisdom: SEAM Is
Not Lean
SEAM is not “lean
management.” It does not seek to remove waste by cutting heads
or streamlining people out of the system. It does not chase
speed at the expense of wisdom. Instead, SEAM is rooted in human-centered
productivity—a deeper form of ROI where
relationships, knowledge transfer, and engagement are valued as
strategic assets.
The Real Cost of
Silence
The greatest cost SEAM
addresses isn’t financial—it’s the
cost of silence. When dysfunctions become “just
the way things are,” organizations calcify. SEAM breaks this
silence. It invites the organization to speak, to listen, and to
reorient its systems not around control but around shared
meaning and vitality.
Final Reflection
S.E.A.M. helps
organizations stop hemorrhaging energy through unseen wounds. It
restores the heartbeat of a healthy system: coordination,
cooperation, communication, and compassion.
When deployed with care and skill, SEAM doesn’t just save
money—it gives people their work lives back.
🌿 Your
Invitation:
Where is your organization hemorrhaging time, trust, or energy?
What is the story behind the silence—and how will you listen for
its wisdom?